OpenLab CDS comes standard with data analysis tools for method development making it easy to customize, implement, and deploy analytical methods and parameters.Additionally, you can automate and accelerate data review andoptimize the routine analysistasks performed by instrument operators – all while supporting review by exception principles.

See for yourself how OpenLab CDS ensures fast and consistent data processing.
Integration Optimization
Use the best integration parameters every time, for every analysis.
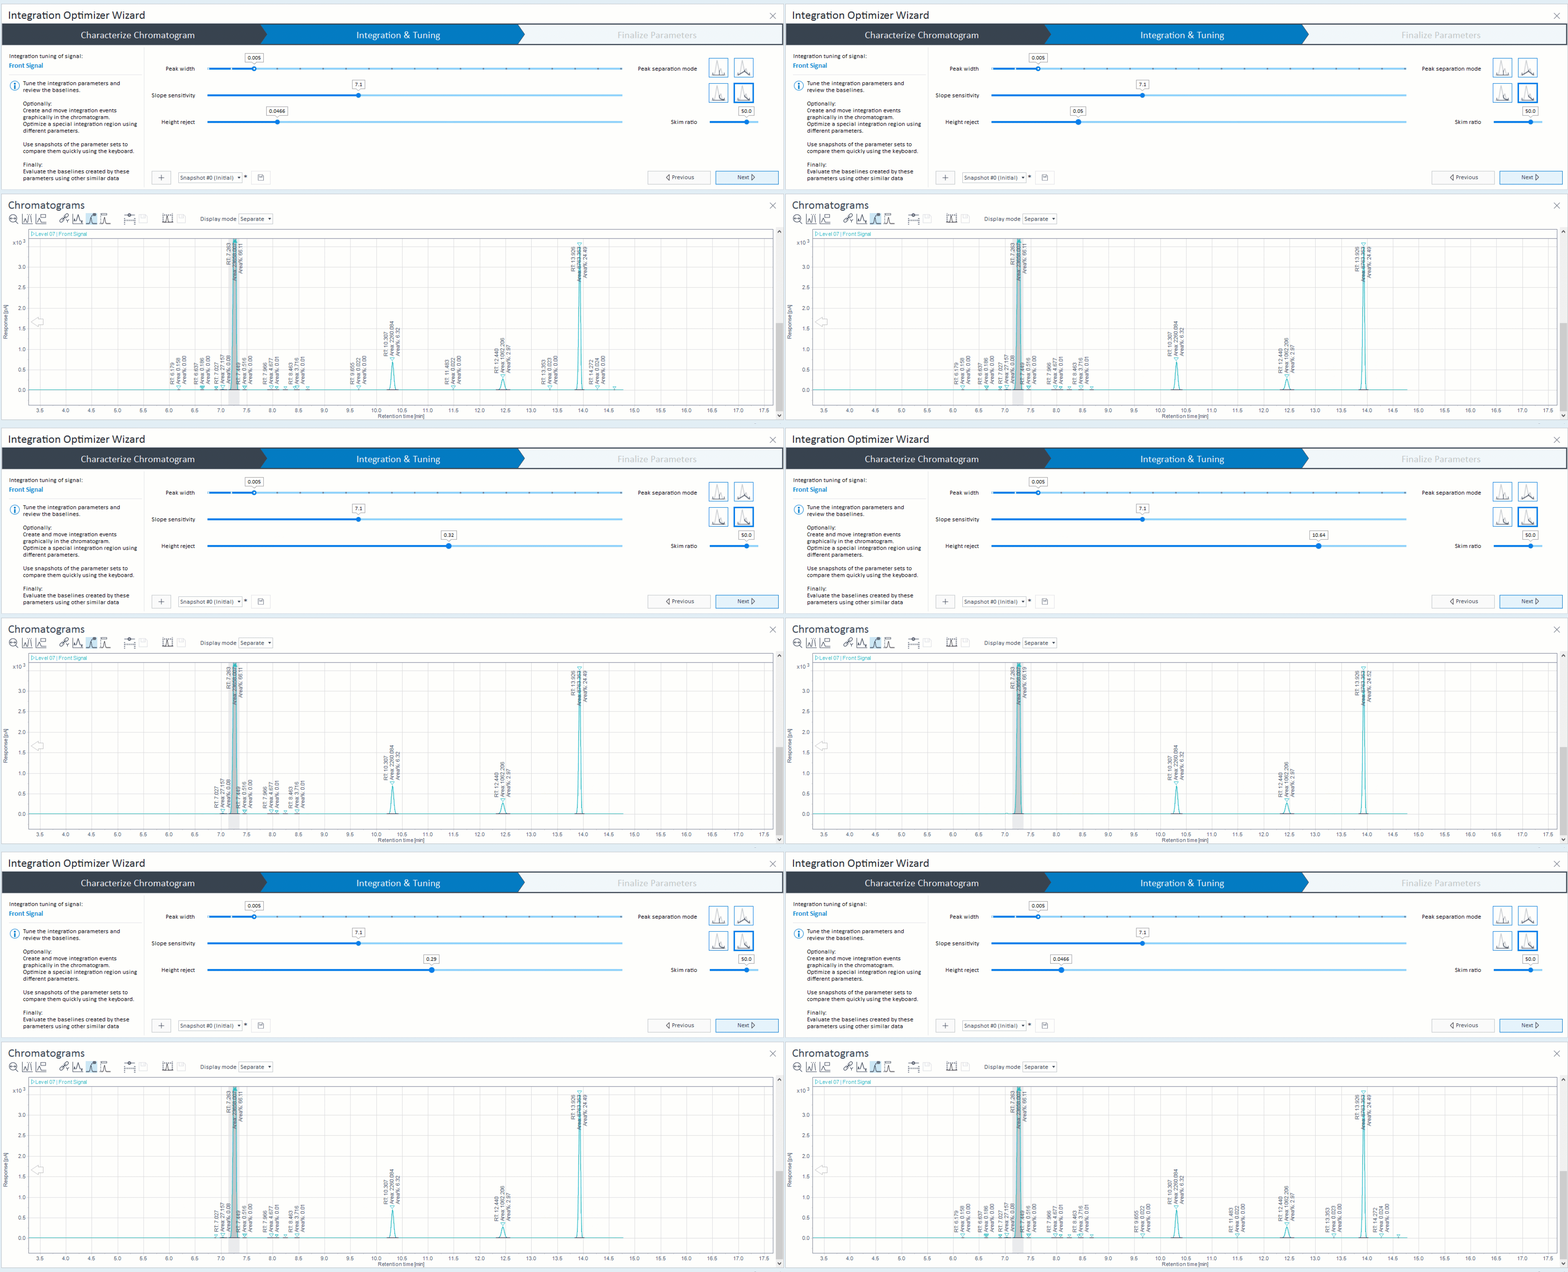
Integration Optimizerguides you to the best setting for your analysis and enables easy deployment of these settings to the lab, enabling you to operationalize faster, more consistent results.Make changes to your integration events and see the results in real-time.
- Softwareallows quick, application-specific optimization of integration parameters with representative data so less experienced analysts can do it right and expert analysts can do it fast.
- Special integration regionsallow you to tune a subsection of the chromatogram with integration parameters independent of the general tuning parameters.
- Baseline annotations and timed eventscan be displayed directly on the chromatogram for a quick visual reference.
Isoplot Heat Map Diode Array
Get a quick assessment of the optimal wavelength for each peak in spectral analysis.
Isoabsorbance Plotsimplifies the task of selecting the optimal wavelength by evaluating all possible wavelengths and presenting a visual heat map that displays the highest signal for your peak(s) of interest, making it easy to identify the best wavelength for use in all subsequent analyses of this type.
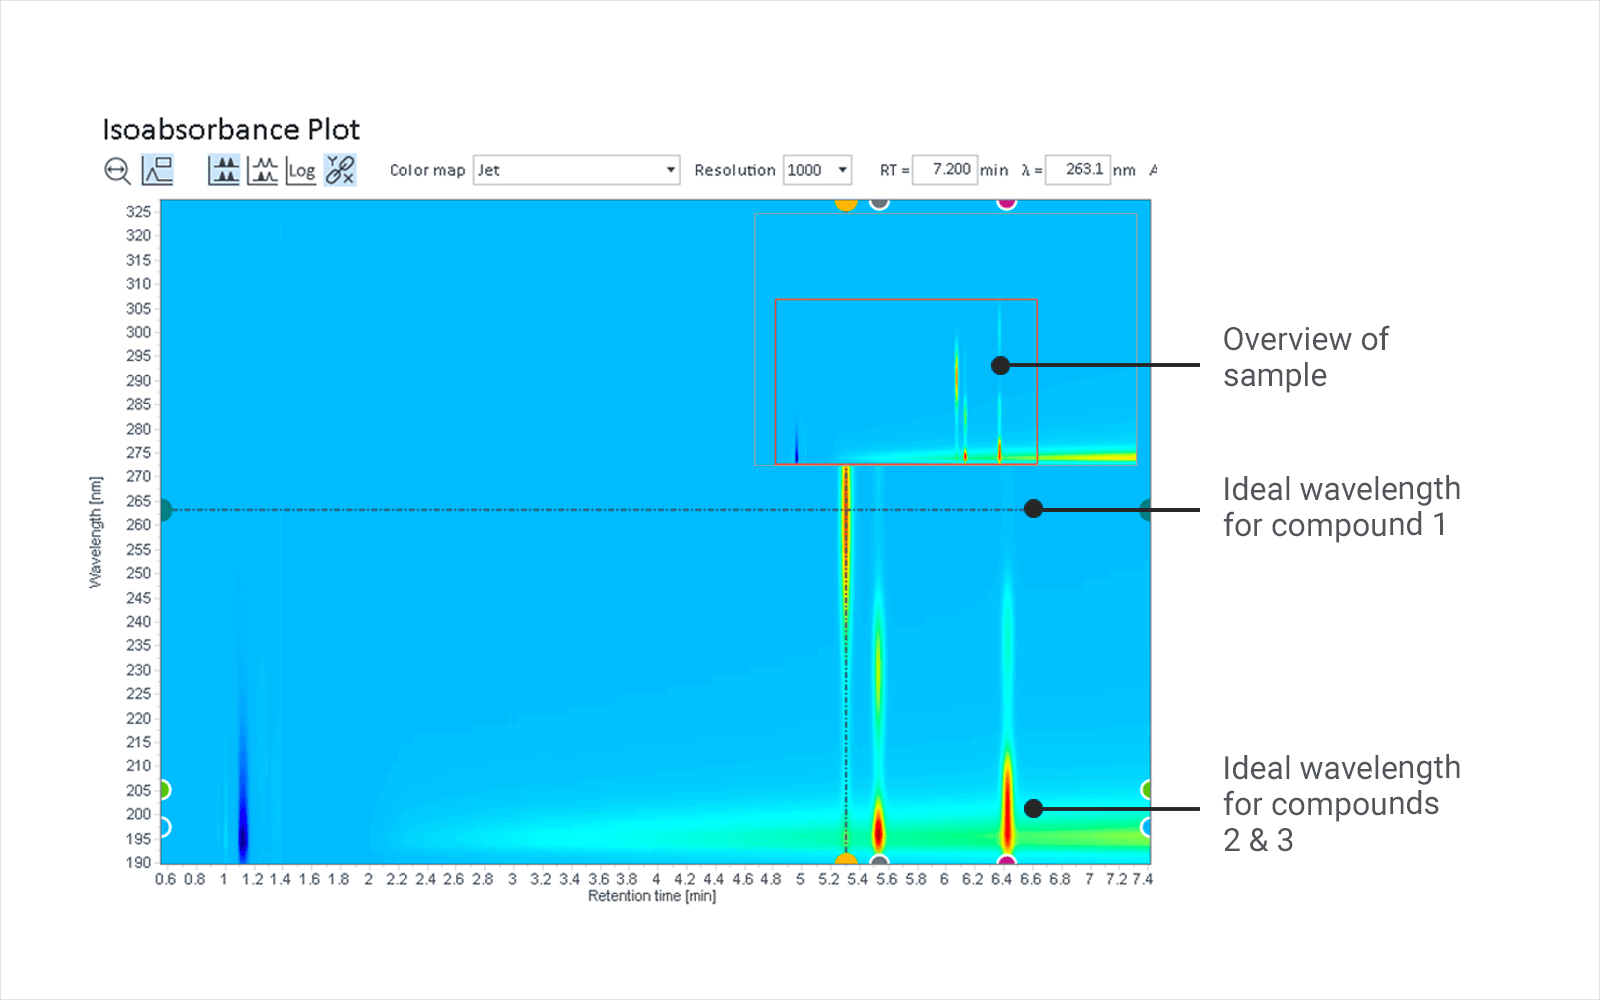
Isoabsorbance Plot in OpenLab CDS plotting wavelength vs retention time.Red signal indicates a high signal!blue indicates a low signal.This is a zoomed view of a complete plot with the full plot represented in the inset at the upper right.The zoomed area is outlined in the inset.
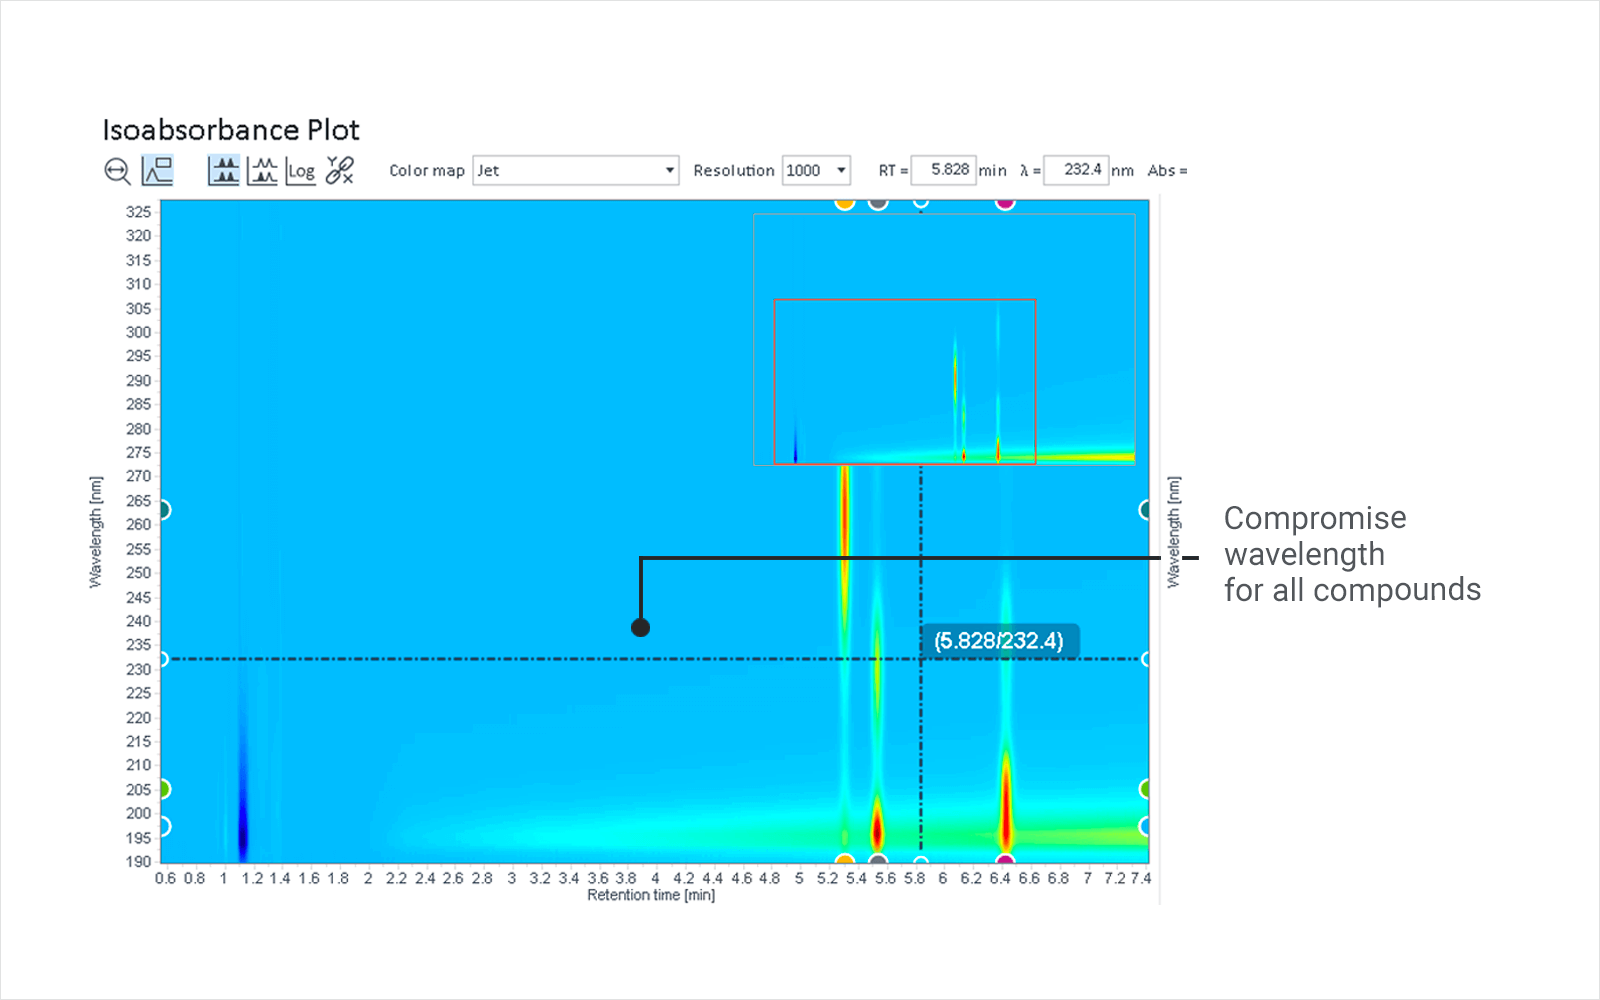
Choosing a wavelength that detects the three compounds of interest for simplified analysis.
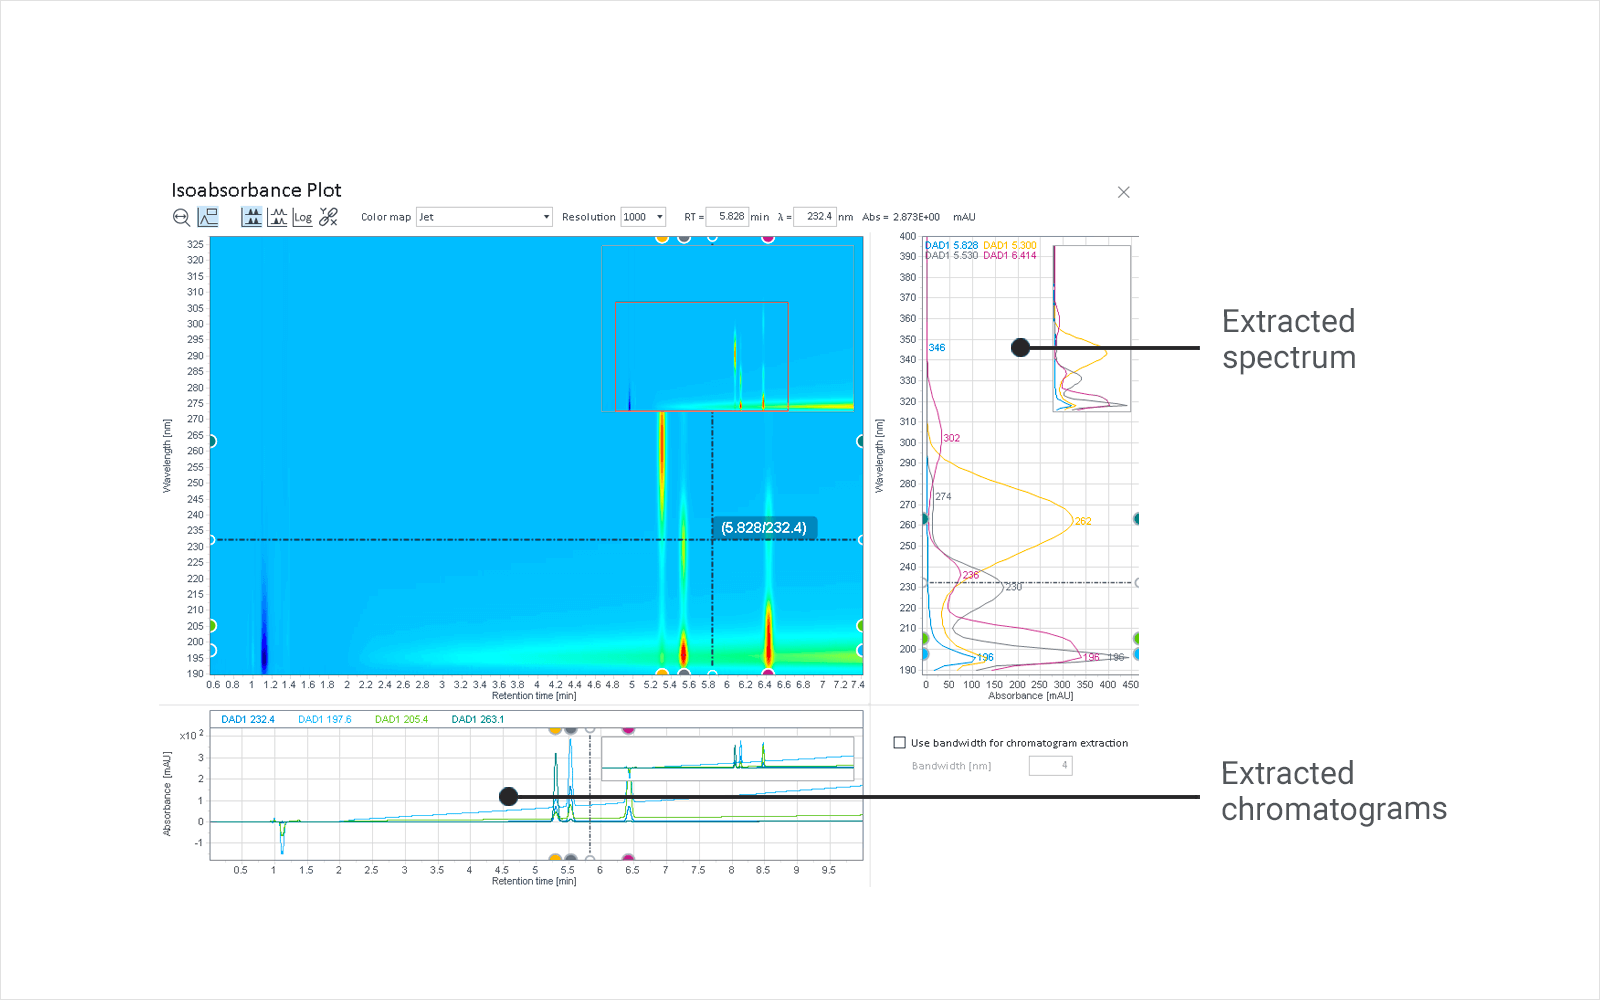
Extracted chromatogram and spectra gives the method developer full insight on analytical results at a given wavelength and contributing components at a given retention time.
Data Flagging Algorithms
Eliminate complex, error-prone calculations and report analytical results more efficiently.
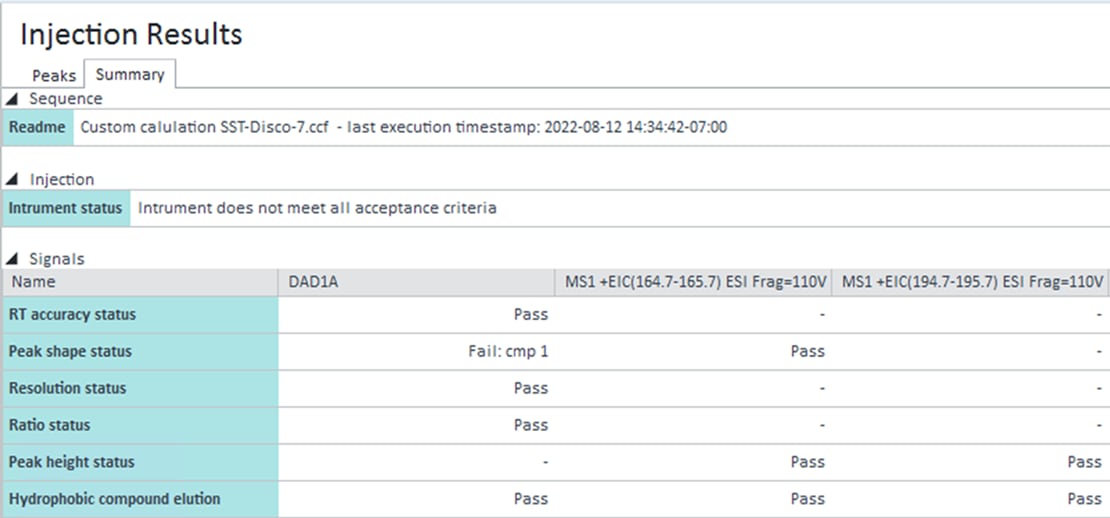
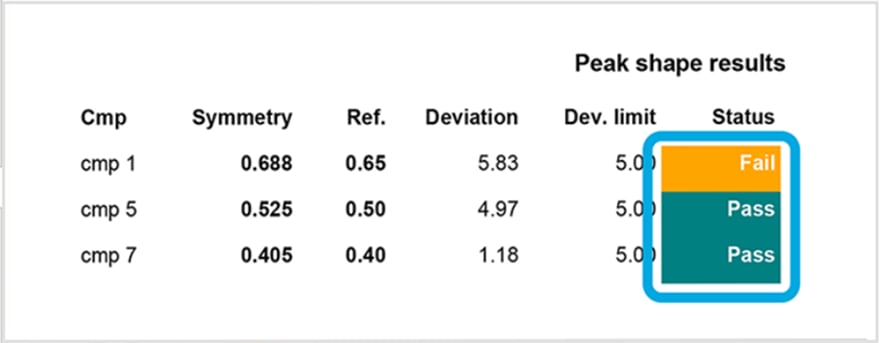
Custom Calculatorin OpenLab CDS allows you to reliably and automatically compute unique values directly within the software rather than using spreadsheets.The method developer can then decide what data passes, fails, or requires further review!how to alert lab personnel to data of interest!and set up custom highlighting to make it easier for the team to ensure that failures or concerns are addressed quickly.
Learn more about using theCustom Calculator tool.
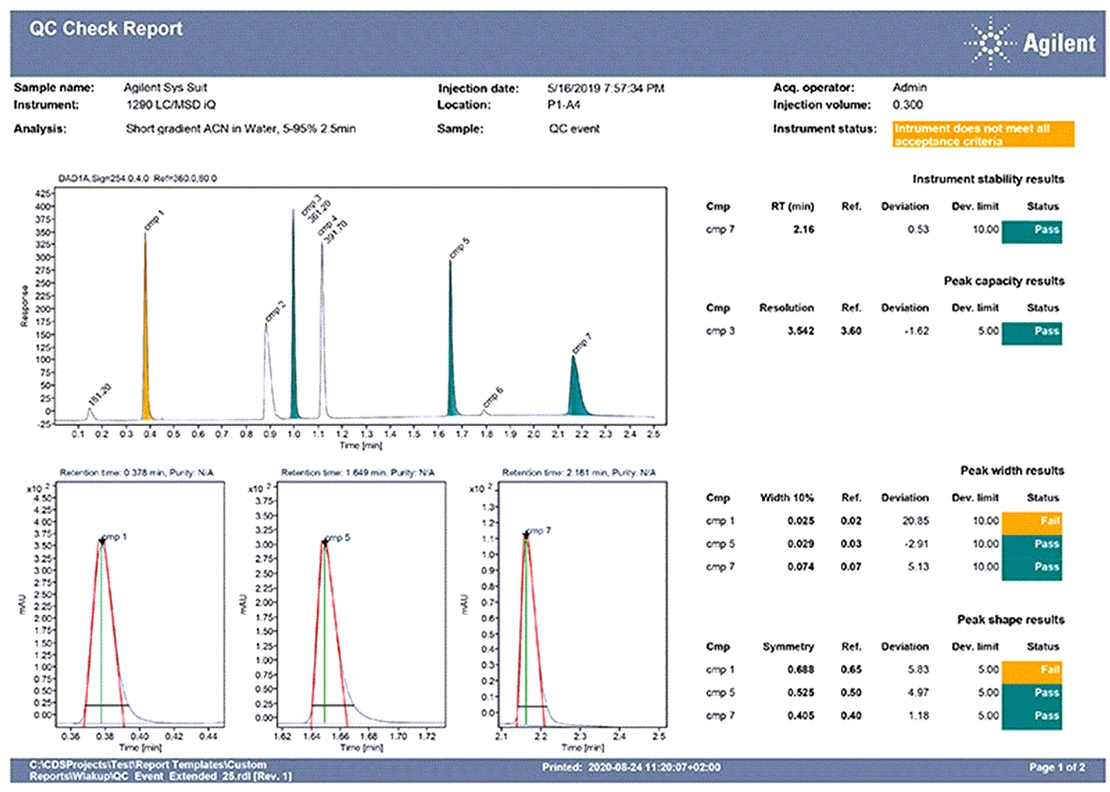
Reportingcapabilities in OpenLab CDS let you quickly create customized, accurate, professional-looking reports that inspire confidence in your data and lab results.This is an example of custom calculated values and conditional formatting in a customized report.
Learn more aboutreporting in OpenLab CDS.
